

Sentinel-2 time series: how we use them to monitor forest regeneration
How we structure Sentinel-2 time series to follow forest regeneration: bands, indices, cloud handling, seasonality, spatial analysis and anomaly detection that guides field work.
Por Diretor Técnico · Geoespacial & Engenharia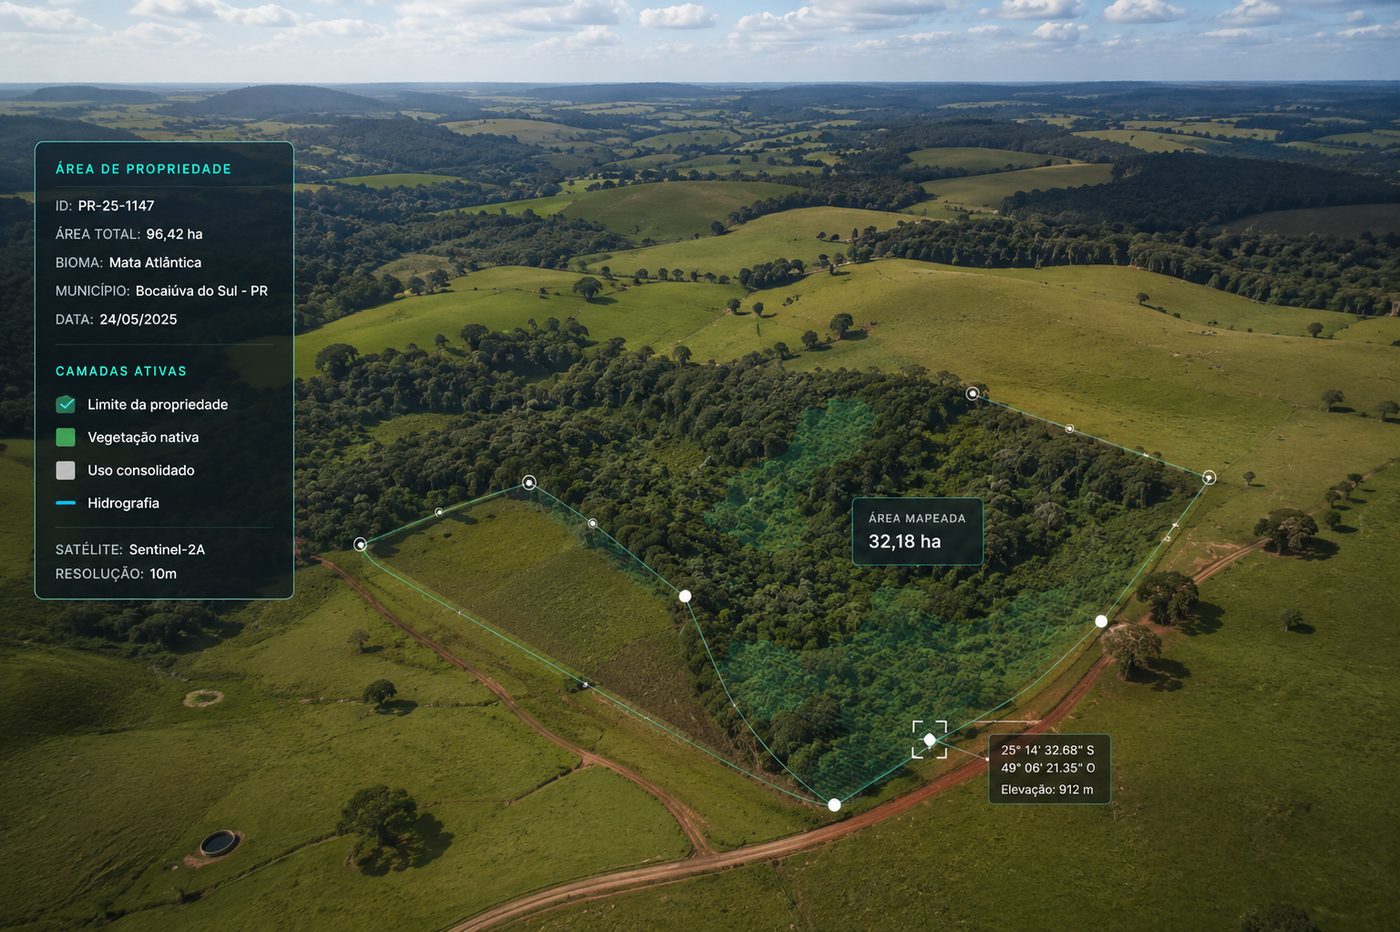
In short
- A green area in an image does not, on its own, indicate ongoing forest regeneration.
- Sentinel-2 works with 13 bands, 10, 20 or 60 metre resolution depending on the band, and revisit of up to five days at the Equator in the nominal constellation setup.
- Time series need corrected products and cloud and shadow handling, or a bad scene becomes a false vegetation loss.
- The polygon average hides internal differences: the analysis also has to be spatial.
- Satellites do not replace field inventory, and a spectral trajectory is not the same as ecological quality of regeneration.
A green area in a satellite image does not mean forest regeneration is under way. It may be herbaceous vegetation, a crop, pasture, an invasive species or just a temporary response of the vegetation to the weather in that period. That is why, when we use Sentinel-2 to follow regeneration, the focus is not on one image or one isolated index. It is on the trajectory of the area over time.
Sentinel-2 was developed for land and forest monitoring. Its multispectral sensor works with 13 bands, including visible, near infrared, red edge and short-wave infrared, with spatial resolution of 10, 20 or 60 metres depending on the band. In the nominal constellation setup, the revisit interval can reach five days at the Equator.
Why is a single image not enough to assess regeneration?
Because two areas can show the same vegetation index value on one date and have completely different histories. One may come from a consistent three-year increase in cover, the other may have been stable from the start. The current value describes a moment; the time series describes a process.
Area A: consistent increase in vegetation response. Area B: stability across the period.
What Sentinel-2 can observe
The MSI sensor records energy reflected by the surface across different regions of the spectrum. Chlorophyll absorbs strongly in the red, the internal structure of leaves produces high reflectance in the near infrared, and water content influences the short-wave infrared. The red edge bands, particularly sensitive to vegetation condition, considerably widen the reading compared with earlier sensors.
Different band combinations reveal different aspects of vegetation. There is no universal index able to answer every question on its own, and the choice of variable has to come from the technical question, never the other way around.
NDVI is useful and should not be used alone
NDVI uses the difference between near infrared and red reflectance. In Sentinel-2 we normally combine band B8, in the near infrared, and B4, in the red, both at 10 metres. Higher values usually indicate greater presence and photosynthetic activity, which makes the index useful for observing an area in recovery.
Scene processing comes before the analysis
A time series should not stack raw images. To compare different dates we work with Level-2A products, which provide atmospherically corrected surface reflectance plus auxiliary information such as scene classification, water vapour and aerosol optical thickness. Without that, the atmosphere itself becomes part of the analysed signal.
Illustrative average NDVI values inside the monitored polygon.
The time series has to distinguish a real change on the surface from a problem in the observation. That separation is what keeps noise from becoming an alert and an alert from becoming an unnecessary field trip.
How we structure a time series
- Monitored polygonproperty, restoration area, plot, protected strip
- Selection of Sentinel-2 imageryby area, period and sensor
- Correction and quality controlLevel-2A products
- Cloud and shadow removalper-pixel quality mask
- Calculation of spectral variables
- Statistics inside the polygon
- Consolidated time series
- Trend and anomaly detection
The polygon average can hide the problem
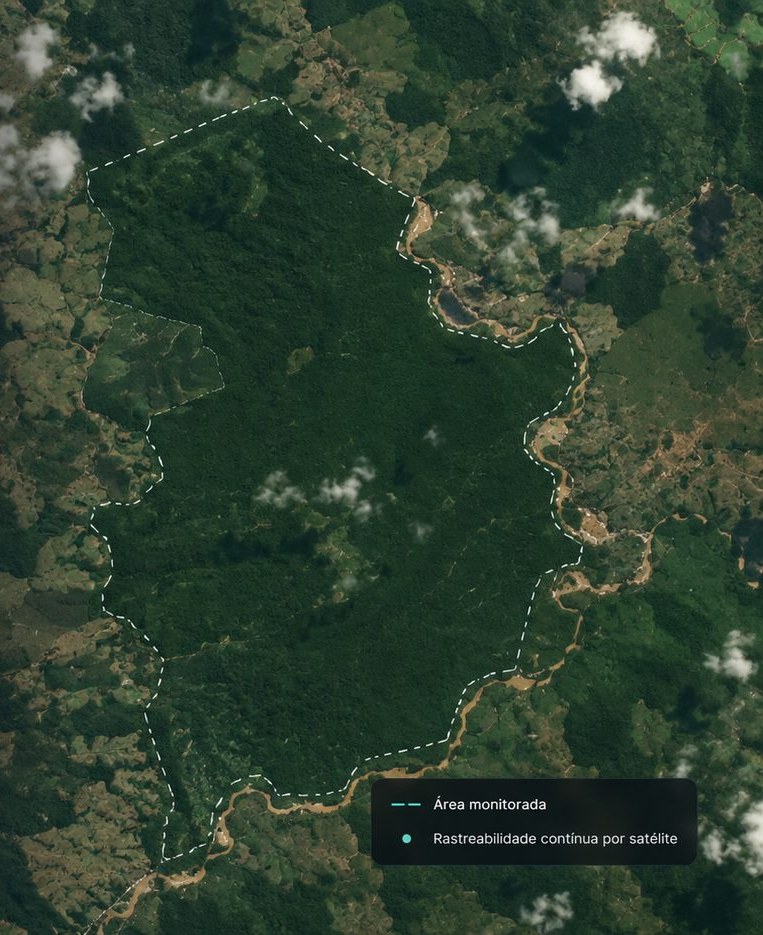
Picture a 100 hectare restoration area where average NDVI increased. The easy conclusion is that regeneration is working. Looking at it spatially, another reality may appear: part of the area evolved consistently while another part barely changed.
It is this reading, not the average, that creates operational priority.
Seasonality has to enter the comparison
Vegetation changes naturally through the year. Rainfall, water availability, temperature and phenology cause significant variation in spectral response. Comparing March of one year with September of the next can produce a false reading of progress or degradation. A robust series compares equivalent periods, such as March 2024, March 2025 and March 2026, or uses temporal composites that reduce the effect of individual observations. The goal is to separate natural variation from structural change in land cover.
How to identify a regeneration trajectory
- 2022, low coverpredominance of bare soil or herbaceous vegetation
- 2023, increase in vegetation response
- 2024, spatial expansion of the responding area
- 2025, greater canopy continuity
- 2026, cover stabilization
Detecting anomalies matters as much as observing growth
Monitoring is not only about confirming that everything is fine. If an area with three years of consistent growth shows a sharp drop in response across 12% of the polygon, the system raises an alert. That does not automatically mean deforestation. It may be fire, management, severe drought, an image problem, a new access road, mortality or a cover change. The system identifies the anomaly; interpretation comes afterwards.
In large areas, continuously checking the whole territory in the field is expensive and operationally hard. The time series replaces the routine of covering everything to find out whether a problem exists with direct guidance: we identified atypical behaviour in these three polygons, let us check them. The result can go to a field app with coordinates, history and the reason for the alert, and the team arrives knowing what to investigate.
Does Sentinel-2 replace forest inventory?
No. Sentinel-2 provides valuable information about land cover and vegetation dynamics, but it does not replace measurements such as DBH, height, species, density, basal area, biomass and carbon stocks. Those parameters still depend on inventory, sampling, allometric models, LiDAR or other sources, according to the objective and the methodology.
- Scale and temporal continuity
- Coverage of large areas
- Change detection and prioritization
- Detailed measurement of parameters
- Model calibration and validation
- Verification of the vegetation actually present
Spectral regeneration is not ecological regeneration
An area with increasing vegetation cover does not necessarily have ecologically satisfactory regeneration. Floristic composition, diversity, successional stage, presence of invasive species and structural quality require specific assessment. Technically, it is more defensible to state that the time series shows a spectral trajectory compatible with increasing and consolidating vegetation cover, and to use field evidence to confirm the nature of that vegetation. The difference in wording looks small and is what keeps the conclusion rigorous.
When the time series really starts to pay off
- New image available
- Quality mask
- Area clipping
- Processing
- Series update
- Historical comparison
- Alert only when needed
The same architecture serves different purposes: restoration projects following cover evolution, ARR projects inside a broader MRV structure, REDD+ projects watching territorial disturbances, companies with rural assets spotting changes across large areas, and financial institutions following territorial portfolios. The technology is the same; the question and the methodological rigour required change.
A useful platform does not deliver just a colourful NDVI map. For each polygon it shows where the area is, which period was analysed, which images were used, the quality of the observations, how indicators evolved, where anomalies exist, when they appeared, which need review and which have already been checked in the field. The interface is the last layer. Behind it there has to be a reproducible historical series.
The value of Sentinel-2 for monitoring regeneration is not the possibility of producing a beautiful image of a property. It is the ability to compare the same territory repeatedly and answer whether cover is progressing, whether that progress is persistent, in which parts of the territory it happens, where behaviour is below expectations and what needs to be checked in the field.
Technical references
- Sentinel-2 mission, MSI sensor, spectral bands and applications — European Space Agency
- Sentinel-2 documentation, Level-1C and Level-2A products, resolutions and Scene Classification Layer — Copernicus Data Space Ecosystem
- Sentinel-2 mission specifications, revisit and MSI characteristics — SentiWiki, Copernicus
Especialista em processamento de dados geoespaciais e modelagem ambiental. Mais de 10 anos em projetos de carbono e inteligência territorial.
This topic is part of one of HIGGN's areas of work. See the related solution
Related content
Need to structure this process in your operation?
Share the technical context of your operation and we will come back with an initial analysis.
Request a diagnostic