

Automated MRV: cutting monitoring costs without losing technical rigour
Where the real cost of MRV sits, what can safely be automated, what must stay under technical judgement, and how to keep methodology, evidence and verifiability in a digital architecture.
Por Diretor Técnico · Geoespacial & Engenharia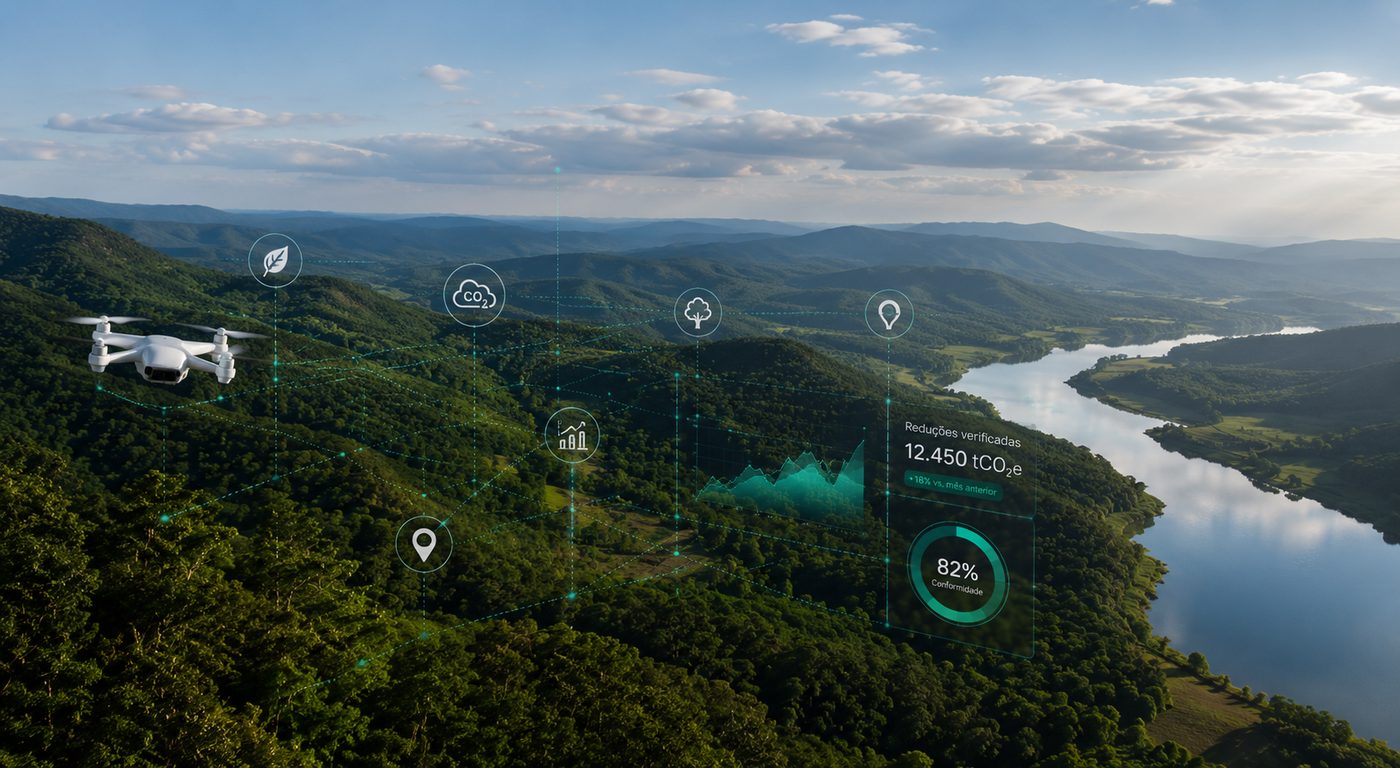
In short
- MRV costs concentrate in repetitive collection, manual processing, late detection of inconsistencies and documentary preparation for verification.
- Well-applied automation separates repetitive work, which goes to the system, from technical decisions, which stay with the specialist.
- Remote sensing does not replace field work: it decides where field work is needed.
- Methodological rules become computational logic only when they stay tied to their source and version.
- In February 2026 Verra approved the first credits under a DMRV pilot with an entirely digital verification.
Monitoring a climate project for years consumes a relevant share of its operational resources. Field campaigns, image processing, spreadsheet consolidation, document review, calculation updates and preparation for verification repeat throughout the project cycle.
The answer to that is not using more technology. Automated MRV creates efficiency when the technology is built around the project methodology and keeps the ability to show where each datum came from, how it was handled, which rule was applied and how the result can be reproduced.
What is MRV and why is it expensive?
MRV covers the monitoring, reporting and verification processes used to demonstrate climate results. The cost is rarely just the trip to the field: it concentrates in repeating collection, transcription, consolidation and documentary reconstruction every cycle, when data, evidence and calculations live in separate tools.
In a carbon project, MRV means turning physical events, such as vegetation growth, land use change or methane capture, into verifiable data able to support a calculated amount of reductions or removals.
- Real activity
- Data
- Evidence
- Processing
- Calculation
- Result
- Verification
Where the cost of traditional MRV sits
Consider a forest project with thousands of hectares. In one monitoring period, the team combines forest inventory, permanent plots, satellite imagery, land cover change alerts, geographic boundaries, activity records, field documents and methodological parameters. When these elements are handled separately, much of the effort stops producing technical knowledge and becomes manual movement of information.
Automation mainly attacks the first three bands, which do not depend on technical judgement.
What can actually be automated
The first step is separating repetitive activity from activity that requires judgement. The logic is not replacing people with machines, but sending repetitive work to the system and giving technical decisions back to the specialist.
- Data acquisition and import
- Application of deterministic rules
- Recurring geospatial processing
- Completeness checks and alerts
- Parameterized calculations and audit trail
- Interpretation of atypical situations
- Methodological definition and eligibility
- Handling of exceptions
- Uncertainty analysis
- Critical project decisions
Risk-driven territorial monitoring
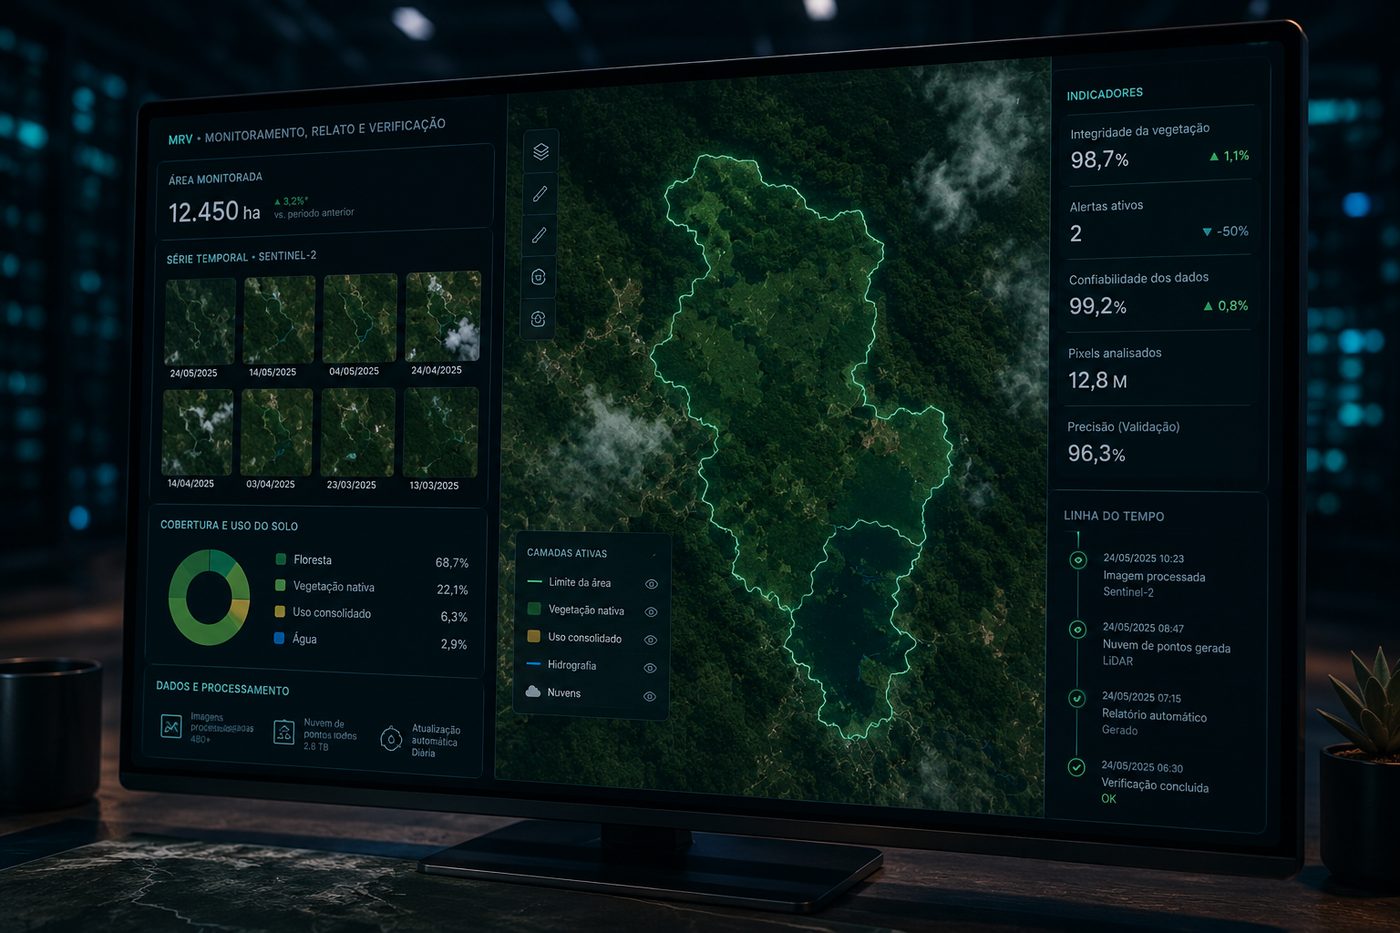
In forest and land use projects, remote sensing reduces the need to physically cover the whole area every cycle. It does not eliminate field work. It uses the digital territory to decide where field work is needed. Image time series support the identification of deforestation, degradation, regeneration, cover change, fire and new access roads.
- Project arearegistered and stratified polygons
- New imageryenters the routine as soon as it becomes available
- Automatic processingquality mask, clipping, indices
- Temporal comparisonagainst the history of the same area
- Change detectionwith an associated confidence level
- Risk classificationprioritizes what deserves attention
- Technical review and field work when needed
An alert records where it happened, when it was detected, which image identified it, the confidence level and the history of the area. The field team investigates a specific hypothesis instead of following a fixed visit routine.
Field apps remove the second data entry
A frequently ignored cost is transcription. The team collects in the field, records on paper or a local file, and someone later transfers it to a spreadsheet or system. Every transfer creates a new chance of error. A field app records coordinates, date, owner, photographs, measurements and plot identification directly, and applies validations at collection time, warning that a DBH is outside the expected range or that a coordinate fell outside the plot polygon.
Automated QA/QC does not mean automatic approval
Automation detects anomalies. That does not mean the machine decides the datum is wrong. If plot biomass grows far above the historical pattern, the system flags an atypical variation and a professional investigates. It may be a typo, a unit change, a duplicated tree, a methodology change or real growth. The system narrows the universe that needs human attention; the specialist determines what it means.
Methodology becomes computational logic, with a version
When a methodology clearly sets out required data, equations, factors, conditions and calculation rules, those elements can be structured in software. Verra has been digitizing methodologies in the Project Hub, allowing digital submission of monitoring data that directly feeds the quantification of reductions and removals. That reduces a common problem in complex operations: the same rule being manually reinterpreted every cycle.
- Methodology
- Version
- Parameters
- Data used
- Rule applied
- Result and execution date
Evidence has to travel with the calculation
A common architecture mistake is automating the calculation and leaving traceability out. A result of 12,485 tCO₂e should not be the centre of the system. It should be possible to navigate backwards: monitored period, strata, data used, plots, sensors and images, processing runs, source files and the people responsible. That is what turns the platform into an evidence trail instead of a calculator.
Remote sensing does not remove field inventory
Satellites, LiDAR, drones and models have greatly expanded the ability to monitor vegetation at scale. Even so, an image does not automatically measure every forest variable with the precision a given methodology requires. Depending on the parameter, field data remains necessary for calibration, validation, model development and uncertainty control. DMRV is not choosing between satellite and field, but integrating both sources in a methodologically defensible way.
Continuous monitoring changes the project's logic
- Data entry by manual consolidation
- Quality control in a later review
- Generalist field campaigns
- Calculations in separate spreadsheets and scripts
- Evidence spread across documents
- Audit as documentary reconstruction
- Continuous integration and import
- Validation when the datum arrives
- Risk-driven field work
- Versioned calculation engine
- Evidence linked to the datum
- Structured trail available at any time
Does automated MRV remove independent verification?
No. Automating monitoring and reporting does not remove governance, technical review or the verification requirements of the applicable programme. A well-built digital architecture tends to make verification more efficient, because the verifier receives organized, traceable and reproducible data instead of a rushed reconstruction.
In Verra's high-frequency pilot, for instance, approval of a DMRV-based verification lets the proponent request 80% of the approved credits, with 20% withheld as a safeguard, and still requires a full verification after one year covering additional parameters such as safeguards and stakeholder engagement.
What the limit of automation is
A good DMRV project knows what not to automate. If a parameter depends on specialist interpretation, deciding automatically increases risk instead of reducing it. A mature architecture distinguishes deterministic rules, which execute, anomalies, which get flagged, uncertainty, which gets quantified, methodological decisions, which go to review, and exceptions, which must be documented. Human decisions also enter the audit trail.
The same applies to artificial intelligence models. They help with land cover classification, change detection and inspection prioritization, as long as the system knows the model version, the input used, parameters, validation, confidence level and review process. In climate activities, explainability and reproducibility weigh as much as computational performance.
Do not start with the dashboard
A digital MRV project should not start from the question of what the screen will look like. It should start from which evidence we need to produce and defend. From there come the methodological requirement, the monitored parameter, the data source, the collection method, the validation rule, the processing, the evidence, the result and the verification. The interface comes later. A beautiful dashboard over fragile data is still a fragile system.
When MRV is digitized with that care, the same infrastructure starts supporting project management, activity tracking, territorial risk, field planning, generation forecasts and document control. The project stops having isolated tools and starts having an operational intelligence layer.
Technical references
- Verra Approves First Credits under DMRV Pilot for High-Frequency Issuances, 19 February 2026 — Verra
- Verra Project Hub, the platform for submitting and managing the project cycle — Verra
- Digitalized methodologies available in the Project Hub — Verra
- Digital Monitoring, Reporting, and Verification Systems and Their Application in Future Carbon Markets — World Bank
Especialista em processamento de dados geoespaciais e modelagem ambiental. Mais de 10 anos em projetos de carbono e inteligência territorial.
This topic is part of one of HIGGN's areas of work. See the related solution
Related content
Need to structure this process in your operation?
Share the technical context of your operation and we will come back with an initial analysis.
Request a diagnostic