

How to structure a GHG inventory that is audit-ready from day one
Boundaries, source registry, activity data with evidence, versioned emission factors and quality controls: the structure that lets you rebuild every result of a GHG inventory during verification.
Por Especialista Ambiental · Carbono & MRV
In short
- A reliable inventory is a system of data, assumptions, evidence and responsibilities, not just a calculation spreadsheet.
- Organizational and operational boundaries must be defined before the first data request.
- Every activity datum should arrive with the evidence that proves its origin.
- Emission factors, assumptions and methodologies need versioning so past results remain reproducible.
- Automated quality controls catch inconsistencies before closing, not during verification.
A greenhouse gas inventory is usually treated as a calculation spreadsheet or as a report produced at the end of the year. That reading works until someone from outside needs to check the result. A reliable inventory is, above all, a system of data, assumptions, evidence and responsibilities able to demonstrate how each number was obtained.
The difference becomes clear during a technical review or an independent verification. Presenting the total in tCO₂e is not enough: you have to rebuild the path between a reported emission and its origin, going through fuel consumption, energy bills, invoices, mileage, waste mass, production data, emission factor, applied methodology and calculation version.
The GHG Protocol organizes corporate inventories around five principles: relevance, completeness, consistency, transparency and accuracy. ISO 14064-1 sets requirements for quantifying, managing, reporting and preparing organizational inventories for verification. Both point to the same place: the quality of an inventory depends on the structure holding the number up.
What makes a GHG inventory auditable?
Auditability is the ability of a third party to rebuild and understand the inventory using only the information, evidence and criteria recorded by the organization. Every relevant result must answer where the datum came from, who provided it, which unit and period it belongs to, which evidence proves it, which methodology and factor were applied and who reviewed the calculation.
When those answers live only in the memory of whoever prepared the inventory, the problem stops being technical and becomes governance. The person moves to another area, the consultancy changes its team, the next cycle starts and the history is gone.
Define boundaries before collecting any data
One of the costliest mistakes is requesting energy bills, fuel invoices and waste records before defining what belongs to the inventory. The first decision is the organizational boundary. The GHG Protocol sets out consolidation approaches tied to equity share or to control over the operation. Once that boundary is set, operational boundaries identify and classify emissions into Scopes 1, 2 and 3.
In practice, that means building an explicit hierarchy before any calculation, from the organization down to the emission source. Without it, corporate changes, sites opening or closing and operational shifts create inconsistencies between periods that nobody can explain two years later.
- Groupconsolidation approach defined and documented
- Companyequity share or operational control
- Siteplant, branch, distribution centre
- Facilitybuilding, warehouse, operational area
- Emission sourceboiler, generator, fleet, refrigeration
Build a registry of emission sources
After the boundaries, the organization needs to identify its sources systematically. The Brazilian GHG Protocol Programme classifies operational boundaries into three scopes: direct emissions in Scope 1, indirect emissions from purchased energy in Scope 2 and the remaining indirect value chain emissions in Scope 3.
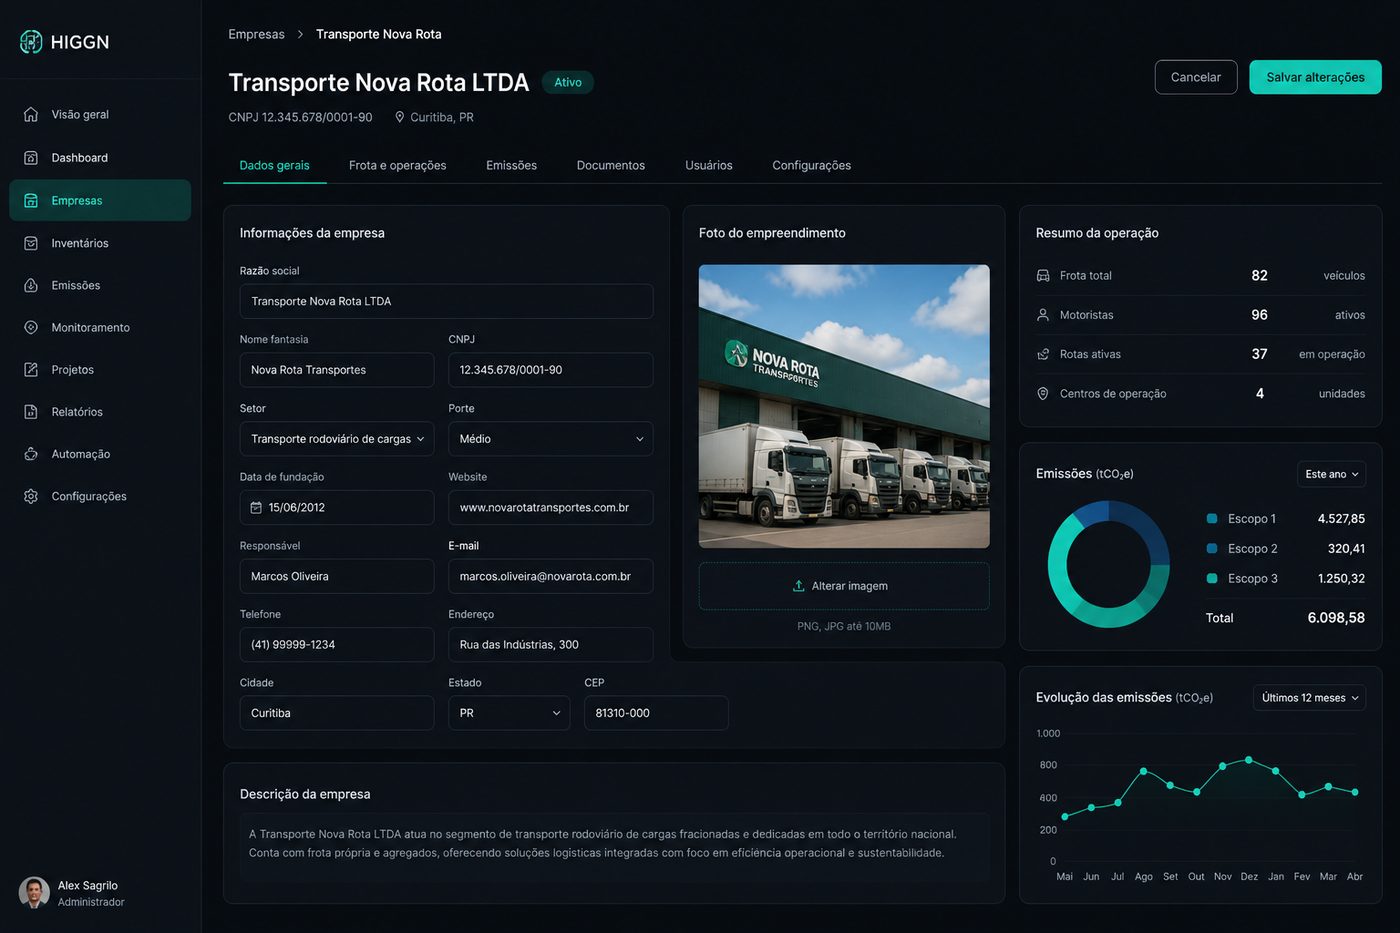
| Field | Example |
|---|---|
| Site | Curitiba plant |
| Source | Diesel generator 01 |
| Scope | Scope 1 |
| Category | Stationary combustion |
| Activity data | Litres of diesel |
| Frequency | Monthly |
| Owner | Operations |
| Evidence | Invoice and refuelling log |
| Method | Calculation by emission factor |
| Status | Validated |
With that registry, new sources come in without breaking the time series, retired sources keep their history, and responsibilities no longer depend on informal arrangements between people.
Activity data must be born with evidence
In most inventories we review, the problem is not in the equation. It is in the origin of the datum feeding the equation. A consumption of 147,820 litres of diesel says very little on its own. It may come from invoices, from the ERP, from tank records, from a fuel card, from telemetry, from a supplier report, from an estimate or from a combination of all of these.
- 147,820 L of dieselreported activity data
- Industrial site Alink to the organizational boundary
- January to Decemberreporting period
- Stationary combustioncategory and scope
- Source documentsinvoices and refuelling log
- Person who submitted itwho answered for the datum
- Review and calculationwho validated it and when
Keep activity data, factor and result separate
Good architecture never stores only the final result. Instead of recording just 372.4 tCO₂e, it preserves the components that produced that value: the activity data, the emission factor with source and version, the unit conversion applied, the GWP reference adopted and the date the calculation ran.
Never overwrite a methodology silently
Picture an inventory calculated in 2025 with a given factor. In 2027 the methodological base is updated. If the system simply replaces the old factor, the historical result changes without anyone noticing. The methodological history must keep source, version, validity, unit, methodology, who updated it, the date it was added and which inventories used that factor. The same applies to assumptions and estimates.
Distinguish measured, calculated and estimated data
Perfect primary data will not always exist, and that does not invalidate the inventory. The problem appears when an estimate is presented as if it were a measurement. Classifying the origin of each record makes the limitation visible and lets you prioritize improvements in the next cycle.
Share of inventory emissions by origin of the activity data.
Scope 2 demands attention to where the electricity came from
The GHG Protocol Scope 2 Guidance distinguishes the location-based and market-based methods for purchased energy. The first mainly uses factors tied to the grid. The second considers contractual instruments that meet the applicable criteria. Recording only a consumption of 1,200 MWh is rarely enough.
- Consuming site and reporting period
- Supplier and contractual instrument
- Certificate or energy attribute involved
- Eligibility criteria met
- Factor applied and accounting method
It is a good example of how a single number can depend on a documentary structure far larger than the spreadsheet cell where it appears.
Scope 3 is, in practice, a data integration problem
The GHG Protocol organizes corporate Scope 3 into 15 categories, covering upstream and downstream value chain activities. That brings very different sources into the inventory: purchasing, suppliers, business travel, transport, waste, capital goods, fuel and energy, sold products and investments.
ERPs, logistics systems, finance, operational platforms and supplier spreadsheets become part of the inventory. This is where spreadsheet-only processes hit their limits of scale, versioning and governance.
Create automated quality controls
A digitally structured inventory finds anomalies before they reach closing. The system does not need to decide that a datum is wrong. It needs to flag that the datum deserves review.
| Check | Example alert |
|---|---|
| Abnormal variation | Diesel consumption 48% above the previous month |
| Missing data | Site B did not report March electricity |
| Duplication | Same invoice linked to two records |
| Incompatible unit | Factor in kg/GJ applied to consumption in litres with no conversion recorded |
| Out-of-range value | Consumption inconsistent with the site's operational history |
Review has to happen before the audit
- Pending
- Received
- Under validation
- Inconsistency identified
- Corrected
- Approved
- Calculated
- Reviewed and closed
In this model, the audit stops being an exercise in reconstruction and becomes the review of a structure that was documented from the start.
Is a spreadsheet enough for a GHG inventory?
It can be enough in small, low-complexity operations. The limit shows up as the number of sites, users, sources, documents, periods and reporting cycles grows. The spreadsheet still calculates well; what it does not support is access permissions, change history, validation workflow, attachments, integrations and comparability across periods.
- Few sites and sources
- One person concentrates the collection
- A single annual cycle
- Evidence kept in folders
- Dozens of sites and hundreds of sources
- Several owners by scope and period
- Recurring, comparable cycles
- Evidence linked to the datum, with version
The minimum structure of a verification-ready inventory
- Boundaries: which companies, operations and sites are included.
- Sources: where emissions occur and how they are classified.
- Activity data: what will be measured, how often and by whom.
- Evidence: how each datum is supported.
- Methodologies: how each emission is calculated, with factor and version.
- Governance: who submits, who validates and who approves.
- Audit trail: how to rebuild any reported result.
When those seven layers are organized, the final report becomes a consequence of the process instead of being the process itself.
A GHG inventory is a continuous process
The Brazilian GHG Protocol Programme adapts the method to the Brazilian context and maintains tools and specific guidance for preparing and publishing corporate inventories, with periodic updates to materials and guidance. Methodologies evolve, factors are updated, companies change perimeter, new sources appear and reporting requirements add up.
From accounting to emissions intelligence
Once data, evidence and methodologies exist in a structured way, the same infrastructure that produces the annual total starts answering management questions: emissions by site, by source and by process, evolution over time, intensity indicators, concentration of the main sources, performance of reduction initiatives, data completeness and supply chain exposure.
It is in that transition, from reporting to management, that technology, automation and data intelligence deliver the most value in a GHG inventory.
Technical references
- Corporate Accounting and Reporting Standard, the reference for corporate inventories — GHG Protocol
- Scope 2 Guidance, accounting for purchased electricity, steam, heat and cooling — GHG Protocol
- Corporate Value Chain (Scope 3) Standard, the 15 value chain categories — GHG Protocol
- ISO 14064-1:2018, organizational quantification and reporting of GHG emissions and removals — ISO
- Brazilian GHG Protocol Programme, the method adapted to the Brazilian context — FGVces
Experiência em estruturação de projetos REDD+ e ARR, com certificações VCS e Gold Standard.
This topic is part of one of HIGGN's areas of work. See the related solution
Related content
Need to structure this process in your operation?
Share the technical context of your operation and we will come back with an initial analysis.
Request a diagnostic